Creator acquisition
How Dependent Is a Creator Business on One Platform?
Measure creator revenue concentration, audience contactability and channel exposure with a practical dashboard instead of a follower-count shortcut.
Short answer
A creator revenue concentration dashboard separates income sources, customer acquisition, permission-based contactability and operating dependencies. Calculate shares on a consistent basis, keep unknown data visible and model one explicit interruption at a time. Use the result to choose a small evidence task or diversification experiment rather than assuming that migration or another website removes every dependency.
Key takeaways
- Revenue concentration and acquisition concentration can point to different services.
- Contact records, current permission, delivery and engagement require separate definitions.
- Several websites can still depend on the same provider or operating account.
- A revenue loss and a delayed receipt need different scenarios and decisions.
- Historical sponsored research provides context; the worksheet's inputs and examples are synthetic.
On this page 10 sections
- What should a creator revenue concentration dashboard show?
- Use research for context, not as your own business data
- Build a consistent revenue baseline
- Map acquisition without counting every click as a customer
- Can you actually reach the supporters you count?
- Map the services behind the apparently independent channels
- Run two different scenarios: loss and delay
- Choose one diversification experiment with a boundary
- Keep unknowns visible in the dashboard
- Decide what to protect before deciding where to move

A creator revenue concentration dashboard should show more than the share of income coming from the largest platform. It should also show where new customers originate, which services control payments and whether the creator has a usable, permission-based way to reach existing supporters.
Those dependencies can point in different directions. A business may collect payments on its own website while almost all new buyers arrive through one social app. Another may have a large mailing list but little current permission or evidence that its messages reach anyone.
This guide builds a practical dashboard around one synthetic creator business. Its examples, revenue figures and contact counts are illustrative, not a survey, a customer case study or an earnings forecast. The accompanying worksheet lets you replace the inputs and see which questions need evidence before deciding to diversify, migrate or invest in another channel.
A white-label Patreon clone can be one option in that evaluation, but a different home for memberships does not remove every external dependency. Start by identifying the relationship you want to protect, then compare the actual operating choices against it.
What should a creator revenue concentration dashboard show?
Start with four different relationships: earning, acquiring customers, reaching supporters and operating the service. A platform can be important in one relationship and replaceable in another. Treating them as a single dependence score hides useful differences.
Earning dependence asks which agreement or service generates the money. Acquisition dependence asks where qualified new buyers first encounter the offer. Contactability asks whether you can reach an identifiable supporter through a route you are permitted to use. Operating dependence asks which infrastructure or provider must continue working for the promised service to function.
For each relationship, write the consequence of an interruption. A discovery-channel problem may reduce future sales without affecting existing memberships. A billing failure may interrupt new payments while members can still read previously purchased material. A content-hosting problem may affect delivery even when revenue and contact records remain accessible.
Do not immediately label a concentrated business bad. A specialist channel may be producing valuable demand at a manageable cost. The dashboard's purpose is to make the exposure visible so the owner can choose a proportionate response, rather than adopting a universal rule that every creator must leave major platforms.
Use research for context, not as your own business data
Patreon's State of Create report provides historical context about creator concerns. Its methodology says the research was conducted in August 2024 with 1,007 creators and 2,002 fans in the United States, with NewtonX involved in the sampling. It was published as a Patreon report, not as an independent measurement of every creator business in 2026.
That distinction matters. A sponsored report can raise a useful question without answering it for your specific audience, market or revenue model. Use it as a reason to inspect your own dependencies; do not turn its aggregate findings into a claim about your members or a promise that a new platform will solve their problems.
Official product announcements have another role: they document a provider's stated plans and terms at a particular time. For example, YouTube's announced Partner Program changes identify different affected groups and a planned February 2027 effective date. An operator should inspect the current official record before applying it to a particular channel.
Keep external research, current policy and your own observations in separate evidence columns. That makes it harder to confuse a market story with a measured business problem, or an announced future change with an interruption that has already happened.
Build a consistent revenue baseline
Choose a closed period and decide what the figures mean. Gross customer payments, amounts paid to the creator and contribution after directly attributable costs are different measures. Pick one basis for the revenue-share calculation and keep the other views alongside it.
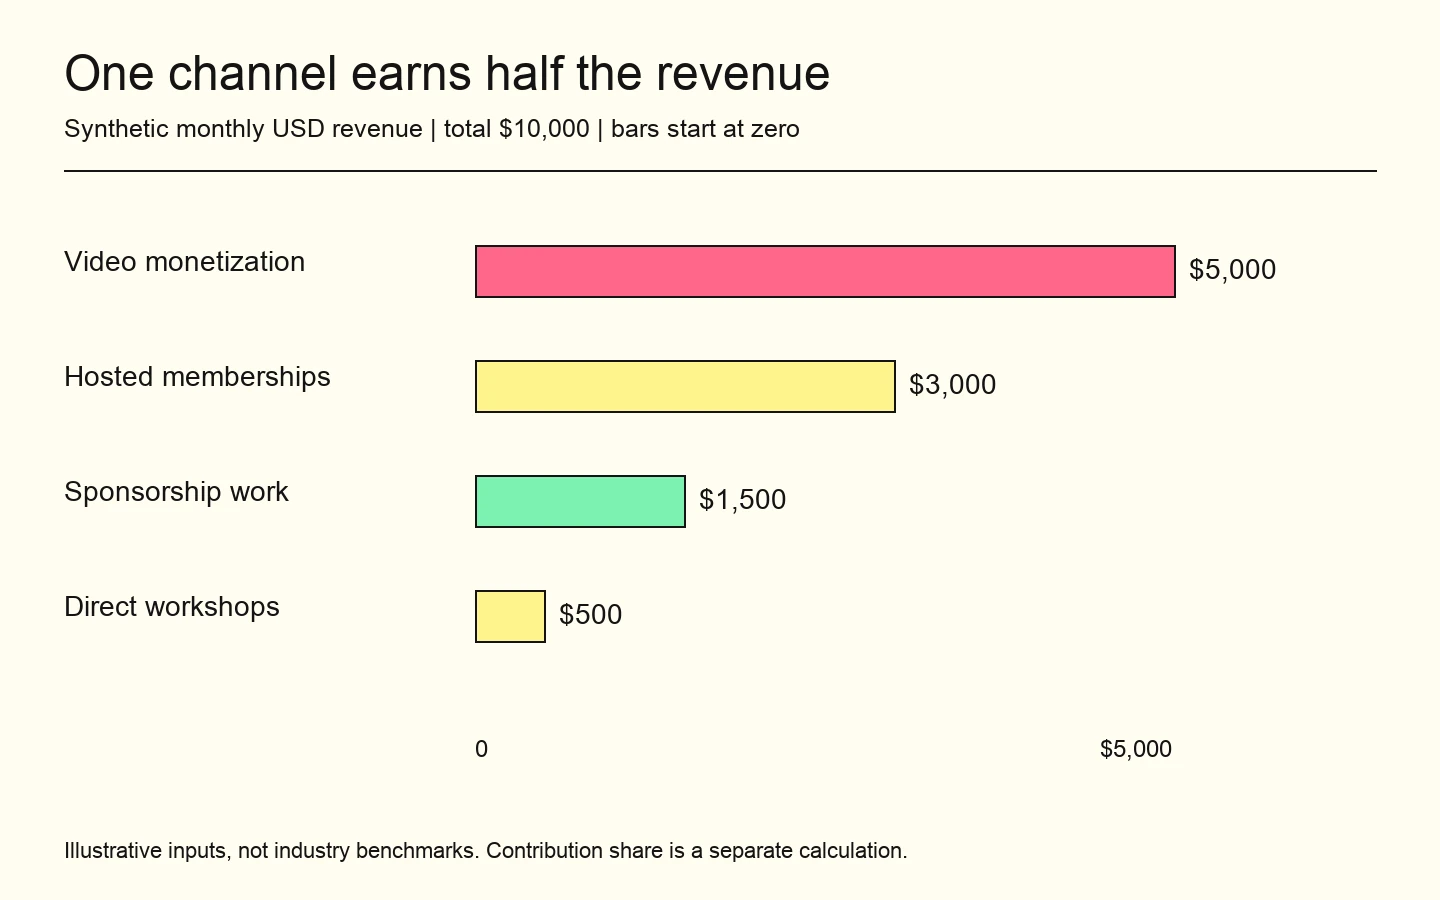
The synthetic business below records $10,000 of monthly revenue on a consistent illustrative basis. The contribution column subtracts assumed directly attributable costs, before shared overhead and taxes. Neither column uses current provider fee schedules.
| Channel | Illustrative revenue | Illustrative contribution |
|---|---|---|
| Video-platform monetization | $5,000 | $3,500 |
| Hosted memberships | $3,000 | $2,400 |
| Sponsorship work | $1,500 | $900 |
| Direct workshops | $500 | $300 |
| Total | $10,000 | $7,100 |
The largest revenue source accounts for 50% of the total. Its contribution share is approximately 49.3%, because $3,500 divided by $7,100 is about 0.493. Those are calculated descriptions of this example, not recommended targets or evidence of industry averages.
Record the period, currency and source document for every real input. If the creator has not reconciled the figures, label them provisional. A dependence calculation built on inconsistent totals can be precise to two decimal places and still be wrong.
Compare the same kind of period
A single sponsorship invoice can dominate one month without representing the business's ordinary pattern. An annual membership receipt can create a similar distortion if you compare cash collections in one period with recognized or allocated revenue in another. Keep the basis consistent and ask the accounting owner how to represent longer commitments.
Where the records permit, retain both a recent period and a longer comparable view. A change in the largest share then has context. It might reflect a genuinely growing second channel, a delayed receipt from the first, or simply a campaign that was timed differently.
Do not repair missing historical data with a fabricated estimate. Mark the shorter observation window and compare only the periods whose definitions you can explain. The dashboard is useful because its assumptions can be inspected, not because every cell contains a number.
Separate channels from customers
One sponsorship customer may dominate a revenue line that appears diversified because it is sold through several websites. Conversely, many workshop buyers can use one payment provider. Add a customer-concentration view where it matters, but do not pretend customer dependence and infrastructure dependence are the same risk.
Map acquisition without counting every click as a customer
Next, ask how the buyers behind those revenue lines arrived. The hosted membership service might process the payment while a video channel supplies almost all new members. That leaves payment concentration and acquisition concentration pointing to different services.
Define an acquisition event that fits the decision. A recorded first visit, a qualified enquiry and a completed purchase are different events. A link click is useful for diagnosing a journey, but it should not silently become an acquired customer in the dashboard.
Keep an "unknown" category. Attribution may be missing, consent choices may limit tracking, and a person may have encountered the creator several times before buying. Assigning every unknown sale to the biggest channel makes the result look complete while increasing the chance of a wrong conclusion.
Write the attribution rule next to the result. If you use a first-recorded-source rule, keep it stable for the comparison period. Do not switch to a last-click rule only for the channel you want to favor. Include referrals, direct visits and unavailable data rather than comparing only the sources that are easy to measure.
Our creator-platform retention metrics guide explains related cohort questions. Keep acquisition and retention separate here: a source can bring many first purchases while another supplies fewer people who remain engaged longer.
Can you actually reach the supporters you count?
A follower total is not a contactability measure. It does not tell you which people can be identified, which communication route is available or whether a particular message is permitted. A downloaded contact file answers only some of those questions.
Patreon's Relationship manager documentation describes a member CSV whose contents reflect selected filters. A creator should inspect the actual export and applicable permissions before planning a new communication journey. Access to a field is not, by itself, a complete permission record for a new use.
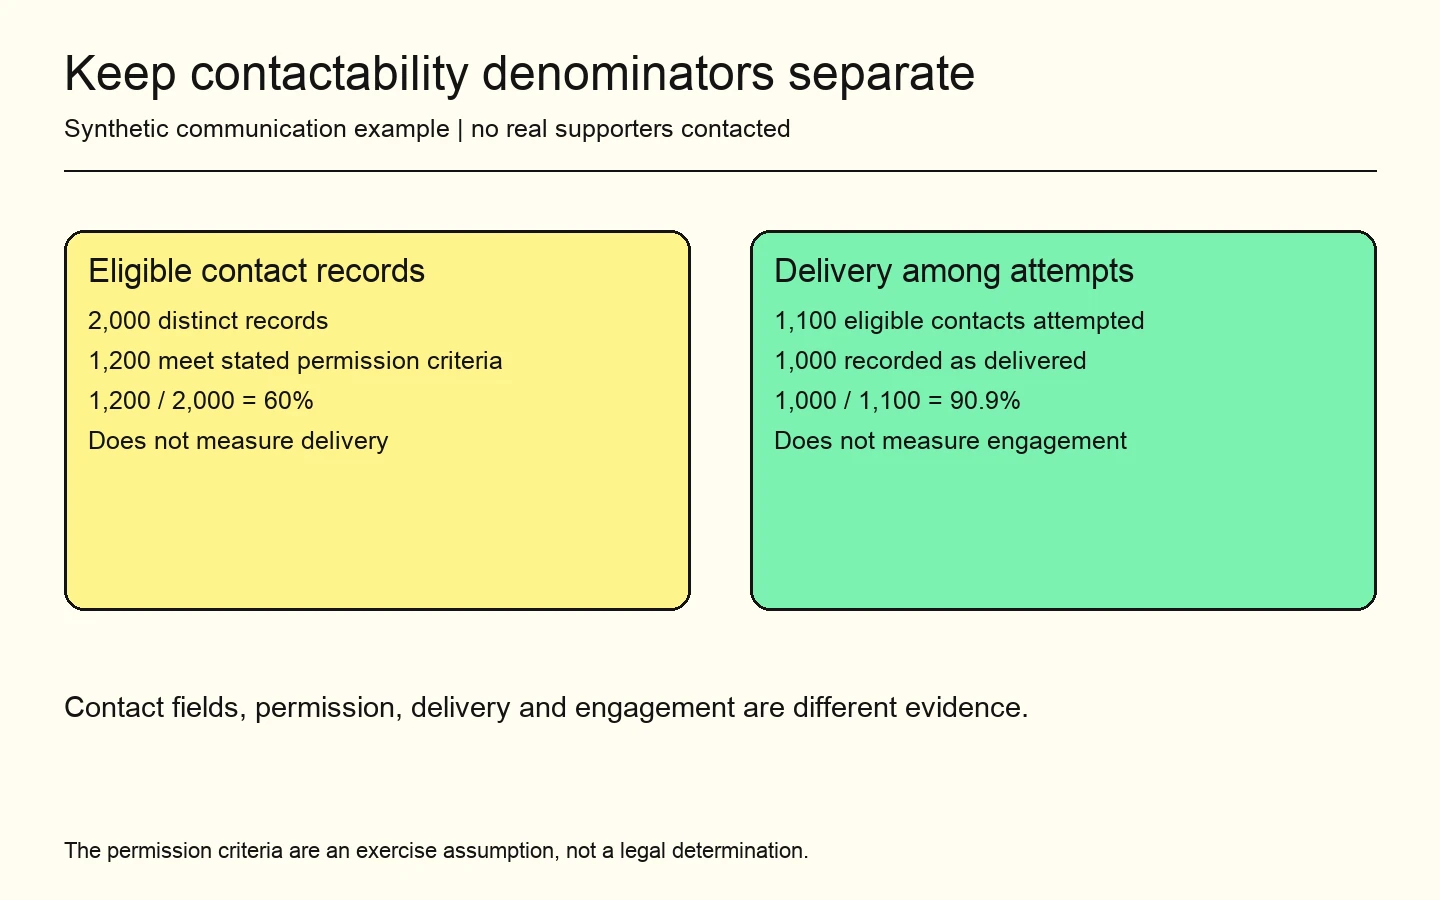
For the synthetic dashboard, assume 2,000 distinct contact records, of which 1,200 meet the exercise's documented current-permission criteria. That gives an eligible share of 60%. It does not establish deliverability, engagement or willingness to buy.
For a separate example campaign, assume 1,100 eligible contacts were attempted and 1,000 messages were recorded as delivered. Delivery among attempts is about 90.9%. Do not divide those delivered messages by an unrelated follower count and call the result an engagement rate.
Keep the criteria and timestamps behind each measure. A permission flag with no scope or provenance is an evidence gap. Mark unknown records separately and get appropriate advice about the actual rules for the sender and audience instead of automatically including them in a campaign.
Map the services behind the apparently independent channels
Two revenue lines can share one failure point. A direct workshop and an independently hosted membership site might use the same billing provider, login service or email system. A dashboard that counts website domains alone will miss that connection.
Create a dependency register with the service, affected workflow, account owner, recovery contact and evidence of any fallback. Keep descriptions practical: "new workshop checkouts depend on Provider B" is more useful than "we own the customer relationship."
For each important dependency, record:
- The exact workflow that would be interrupted.
- The company account and role that control the relationship.
- The evidence supporting any proposed fallback.
- The users who would need a clear explanation.
- The next review date and responsible person.
Distinguish a documented fallback from an available alternative in the market. Another payment provider existing does not mean your account is approved, your integration is ready or existing recurring agreements can move. Stripe's customer-data migration guide illustrates why payment migration involves coordination and remapping rather than a simple contact-file import.
Do the same for content. Having original video files is different from being able to restore a catalogue with the correct access rules. A copy of source code is different from a build another team can operate. Our data ownership guide covers those distinctions; the dashboard should link to evidence of control instead of treating ownership as a single yes-or-no label.
Use the same register when reviewing Patreon clone features and the development-company handover. Record which workflow is being discussed, who will operate it and what evidence would demonstrate the agreed result. A feature description and an operating responsibility answer different questions.
Run two different scenarios: loss and delay
Use scenarios to expose decisions, not predict the future. Begin with one named interruption, a stated duration and an explicit assumption about which other income or costs remain unchanged. Keep the scenario separate from the business's actual results.
In the synthetic example, suppose video-platform monetization falls by 50% for one month. Revenue becomes $7,500 if the other three channels remain unchanged. If that channel's contribution scales proportionally under the exercise's simplified assumption, total contribution falls from $7,100 to $5,350.
The assumption is important. Real costs may not decline proportionally, sponsorship may share the same discovery source, and additional workload may affect other offers. Record those possibilities rather than presenting the spreadsheet result as a forecast of a real creator's income.
A delay is different from a loss. Suppose the expected $5,000 receipt is delayed while $4,500 of commitments fall due before any other receipts. With $3,000 of opening available cash, the illustrative timing gap is $1,500. The scenario does not reduce the final revenue total simply because receipt is later.
Use the result to identify the evidence and decisions needed: a verified payment timeline, adjustable commitments or a reviewed continuity plan. It is not a recommendation to borrow, hold a prescribed reserve or assume that an expected receipt will arrive on a particular date.
Choose one diversification experiment with a boundary
The dashboard should lead to a small decision, not a demand to build every channel at once. Identify the dependency that matters most to the business and choose one experiment that can test a practical alternative.
For a creator whose new customers come through one feed, that might mean offering a clearly described workshop through an existing permission-based channel. For an agency, it might mean testing a second qualified lead source. Neither requires moving all supporters or promising that a privately operated platform will remove every dependency.
Write down the offer, intended audience, permission basis, cost limit and completion event. Distinguish an enquiry from a purchase and a purchase from successful delivery. Keep the original source visible even if the buyer completes checkout elsewhere.
Choose a stopping condition before spending time or money. A useful experiment might be stopped because the audience cannot understand the offer or delivery takes more work than expected, even when clicks look encouraging. A positive result needs the opposite discipline: do not extrapolate a handful of buyers into an annual revenue forecast.
The optional experiment is a planning choice, not authorization to contact supporters, run paid advertisements or change payment providers. Obtain the necessary approvals for those actions separately. The dashboard can be built first from existing permitted records and synthetic examples while those decisions remain open.
Keep unknowns visible in the dashboard
A founder may have enough information to calculate revenue concentration and still lack a reliable picture of acquisition or contactability. Show those gaps as separate fields. A complete-looking dashboard assembled from assumptions can be more misleading than a short one with explicit unknowns.
Use evidence states such as verified statement, reconciled internal record, provisional estimate and unavailable. Attach a check date and responsible person. A platform policy may need rechecking more often than a historical bank statement, but both should remain traceable.
Do not combine every measure into an invented independence score. A 50% revenue concentration, a particular contactability rate and an untested recovery route cannot be averaged into a meaningful certification without a defensible model. Present the components and the resulting decision instead.
The accompanying worksheet calculates the synthetic revenue shares, contribution shares, communication denominators and interruption scenarios separately. It includes a blank dependency register for your own evidence. Its checks validate the supplied arithmetic; they do not establish market demand, legal permission or a real creator's operational resilience.
Review the dashboard after a material change in the business, such as a new offer, provider arrangement or acquisition source. Keep prior snapshots so a changed definition is not mistaken for improved performance. Compare like with like before celebrating a lower concentration percentage.
Use a short decision meeting rather than circulate the chart without an owner. Choose one scenario, identify the first commitment that could not be met and assign one evidence task. The next meeting should check that task before adding another set of colored indicators.
For example, if workshop revenue appears independent but the team cannot explain its acquisition source, the next task is to inspect the existing journey and attribution rule. It is not automatically to buy advertising or build another website. If the permission records are incomplete, the task is to resolve their scope before using a new communication tool.
Record decisions that deliberately accept concentration too. A creator may choose to keep a productive channel while preparing a documented response to interruption. That can be more coherent than spending heavily on weak alternatives merely to lower a percentage. The dashboard should make the trade-off explicit, including what evidence would cause the decision to change.
Show a shared settlement dependency beside separate revenue lines
Consider a separate fictional business with $4,000 of membership receipts and $2,000 of workshop receipts expected during the same period. The offers have different websites, audiences and delivery teams, but both settle through the same provider account. Counting them as two channels describes the commercial offers accurately. Counting them as two independent settlement routes does not.
In this example, suppose the full $6,000 is delayed beyond the date a $2,500 operating commitment falls due. The owner has $1,800 of available opening cash and no other receipts before that date. The immediate timing gap is $700. The delay does not, by itself, turn $6,000 of expected receipts into a $6,000 revenue loss. Keep the affected receipts, available cash and due commitments visible as separate amounts.
The dashboard should therefore preserve both offer rows and add a dependency group for the shared settlement account. Display $6,000 as the amount exposed to this particular delay assumption, with links to both underlying rows. Do not add that group total to revenue again. It is a second view of the same receipts, intended to reveal a common interruption point.
Now change the scenario: workshop discovery fails, while settlement continues normally. Only the workshop acquisition journey is directly affected under that assumption. Existing memberships may keep collecting and delivering. The difference shows why a single concentration percentage cannot describe every interruption. The useful unit is a dependency attached to a specific workflow and consequence.
Add evidence fields for the provider account owner, expected settlement record and any proposed response. An alternative provider's website is not proof of a working fallback. Until approval, integration and the relevant agreement handling have been established, display the fallback as unresolved. The operator can then decide whether the next task is checking a receipt date, revising a commitment or investigating an alternative route, with the underlying uncertainty still visible.
Decide what to protect before deciding where to move
Start with the relationship the business cannot afford to interrupt: reliable delivery to existing members, a usable communication route, accurate payment records or access to the content catalogue. Then identify the evidence that protection currently depends on.
Sometimes the right next action is documentation, permission cleanup or a recovery drill. Sometimes it is an acquisition experiment. Migration is one possible response, not the automatic conclusion of a concentration chart. It also introduces work, new dependencies and a need to honor existing commitments.
If migration becomes a justified option, our Patreon migration guide explains the wider planning questions. Use the dashboard first to state the problem you are trying to solve, then compare the actual options against that problem rather than against the vague promise of owning an audience.
At the next business review, bring four answers: where the money comes from, where new buyers originate, whom you can appropriately reach and which services must keep operating. Record what is known, what was assumed and one next check. That is enough to make platform dependence a manageable discussion instead of a slogan.
If the evidence points toward a membership project, compare our Patreon clone platform with the other relevant choices using those same criteria. The useful outcome is a decision supported by the business's records, not a lower concentration percentage achieved by creating another account.
Download the companion files
Download the companion kits and worksheets. Worked examples are labeled synthetic, public-source registers retain their references, and unrun protocols are identified. Read each kit's method and limits before using it.
Questions and answers
What should a creator revenue concentration dashboard include?
Include revenue shares on a consistent basis, the origin of qualified new customers, permission-based ways to reach supporters and the services required to operate the business. Keep source dates, definitions and evidence states attached. A single percentage cannot represent every kind of dependence or certify that a business is resilient.
What is a safe level of revenue concentration?
This guide does not prescribe a universal threshold. The consequence depends on the business's obligations, cash timing, alternative routes and actual operating arrangements. Use a stated interruption scenario to identify the first decision or commitment affected, then gather the evidence needed to choose a proportionate response.
Does an email export mean I own my audience?
An export supplies fields, not a complete answer about the permitted use, delivery or continued engagement of those contacts. Check the actual record scope and permissions before planning a communication journey. Measure eligible records, attempted messages and delivery with their own denominators instead of substituting the follower count.
Does an independently hosted membership remove platform dependence?
It may change some relationships while leaving others in place, such as payments, identity, content hosting or customer acquisition. Document which services each workflow needs and what evidence supports any fallback. Do not treat a different website address or possession of source code as proof that every dependency has disappeared.
Are the dashboard figures an industry benchmark?
No. The revenue, contribution, contact and cash figures are synthetic examples used to demonstrate calculations. Patreon's separately cited research is historical sponsored US research, not a measurement of this business or all current creators. Replace the worksheet inputs with reconciled records and retain the relevant scope and definitions.
Sources
- Patreon: State of Create report and methodology
- YouTube: announced Partner Program changes
- Patreon: Relationship manager and member export scope
- Stripe: customer-data migration responsibilities
Source review dates are recorded in the article and companion material. Draft modification dates do not establish a new source check. Rules, fees and programme terms change; confirm on the source before you rely on them.